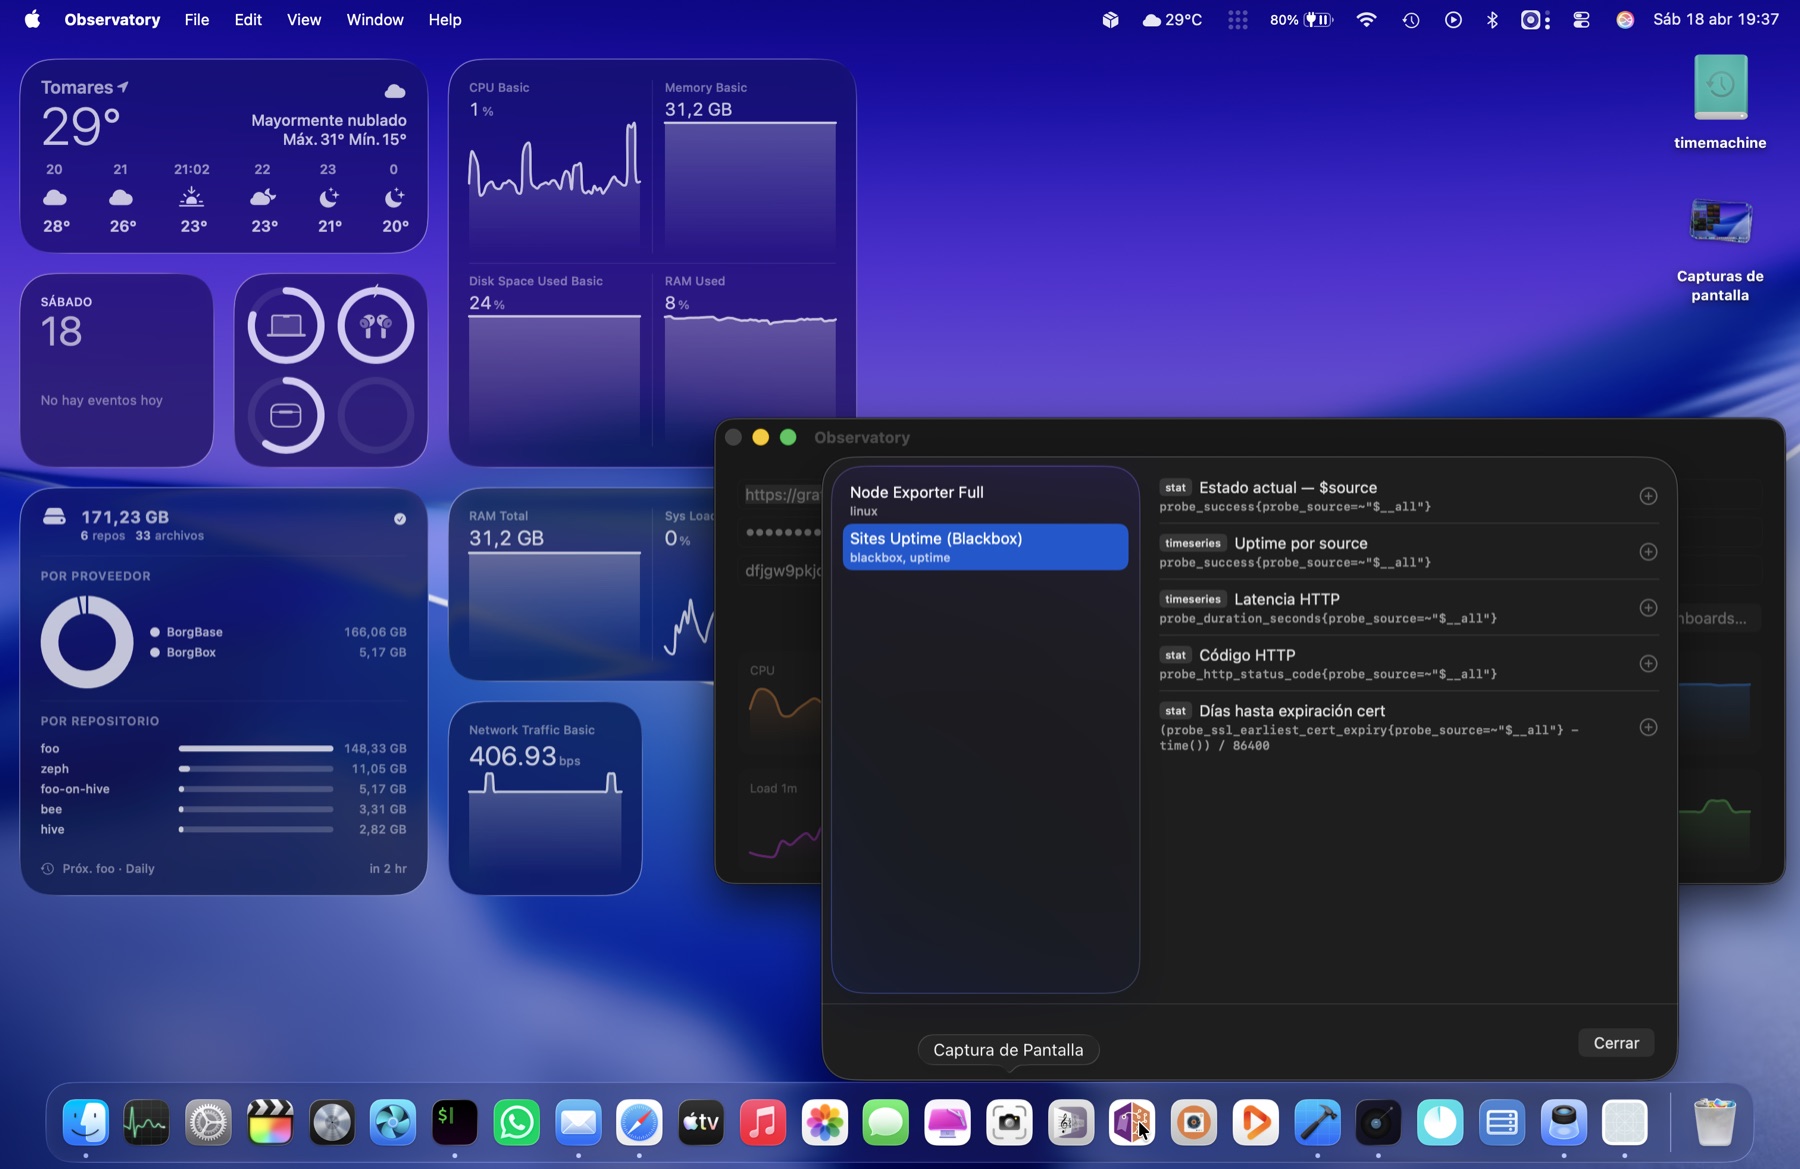
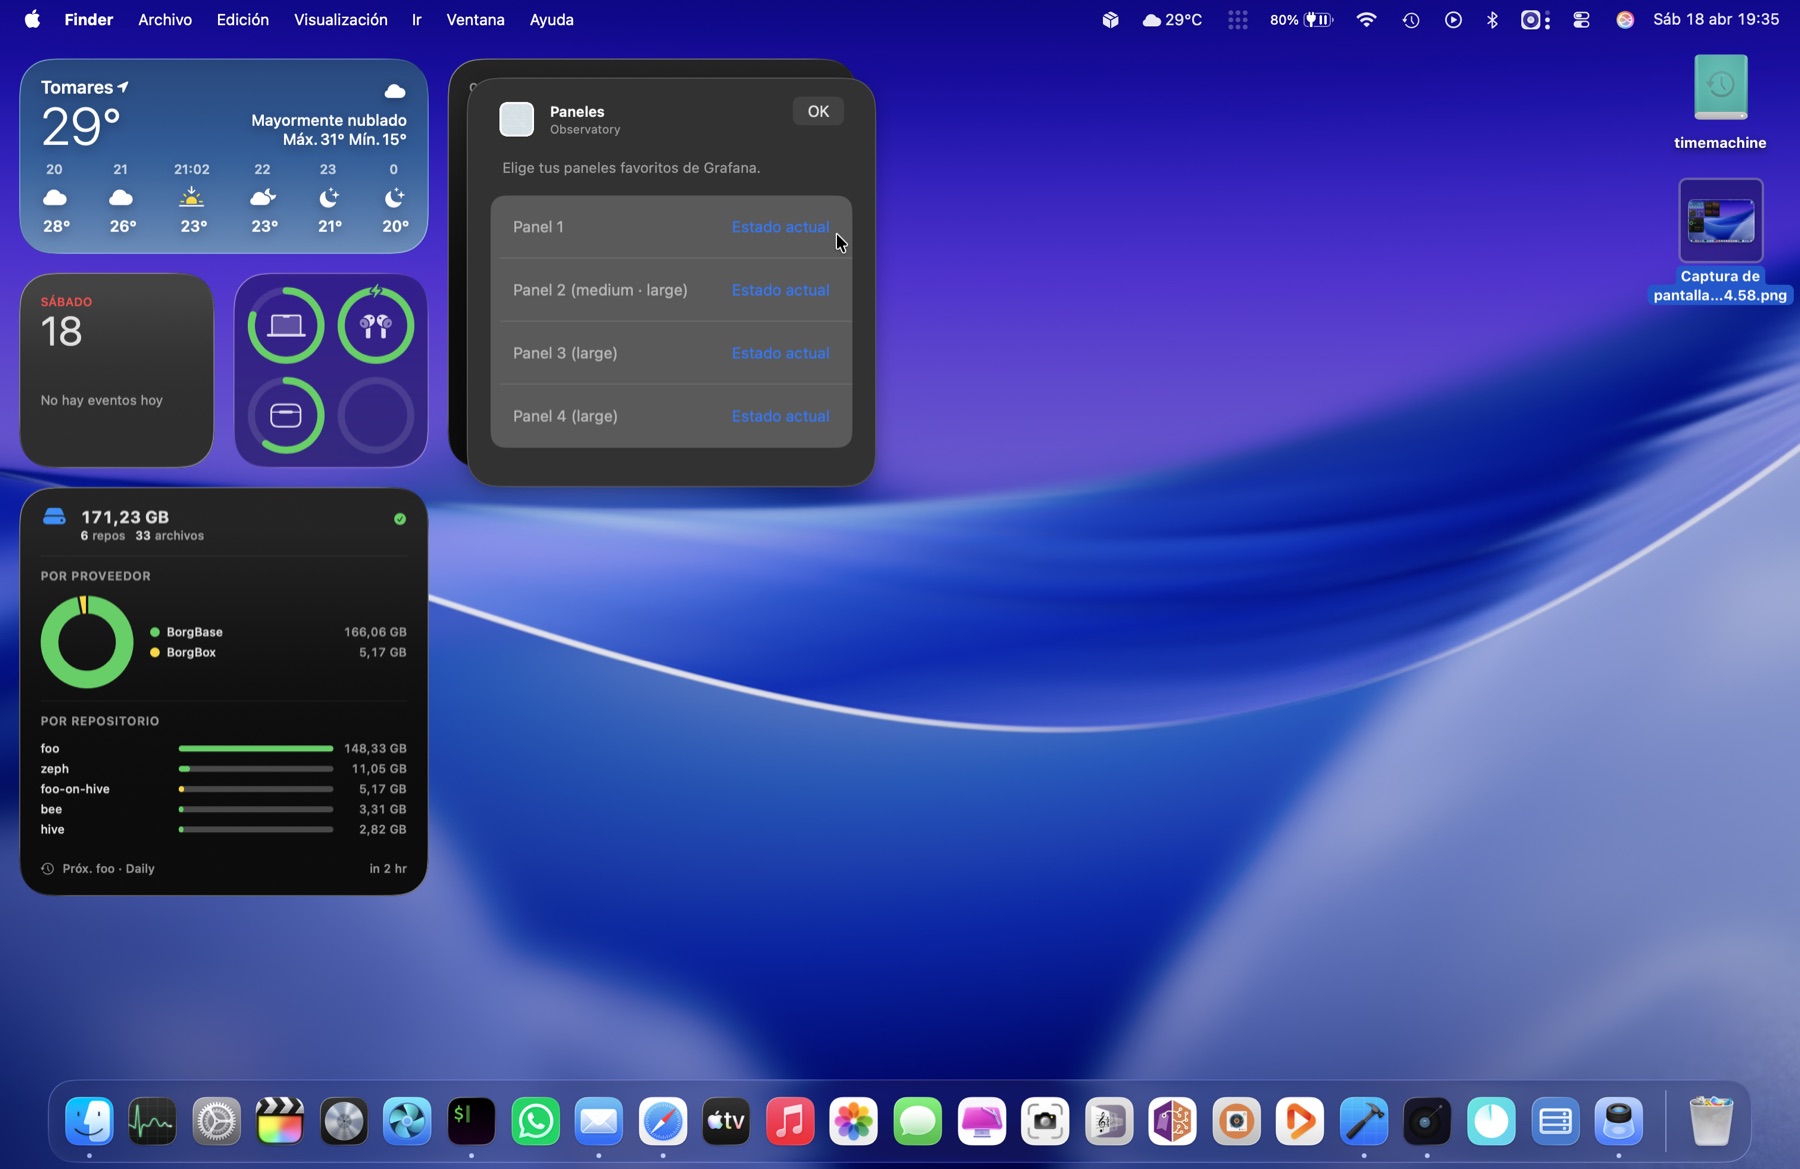
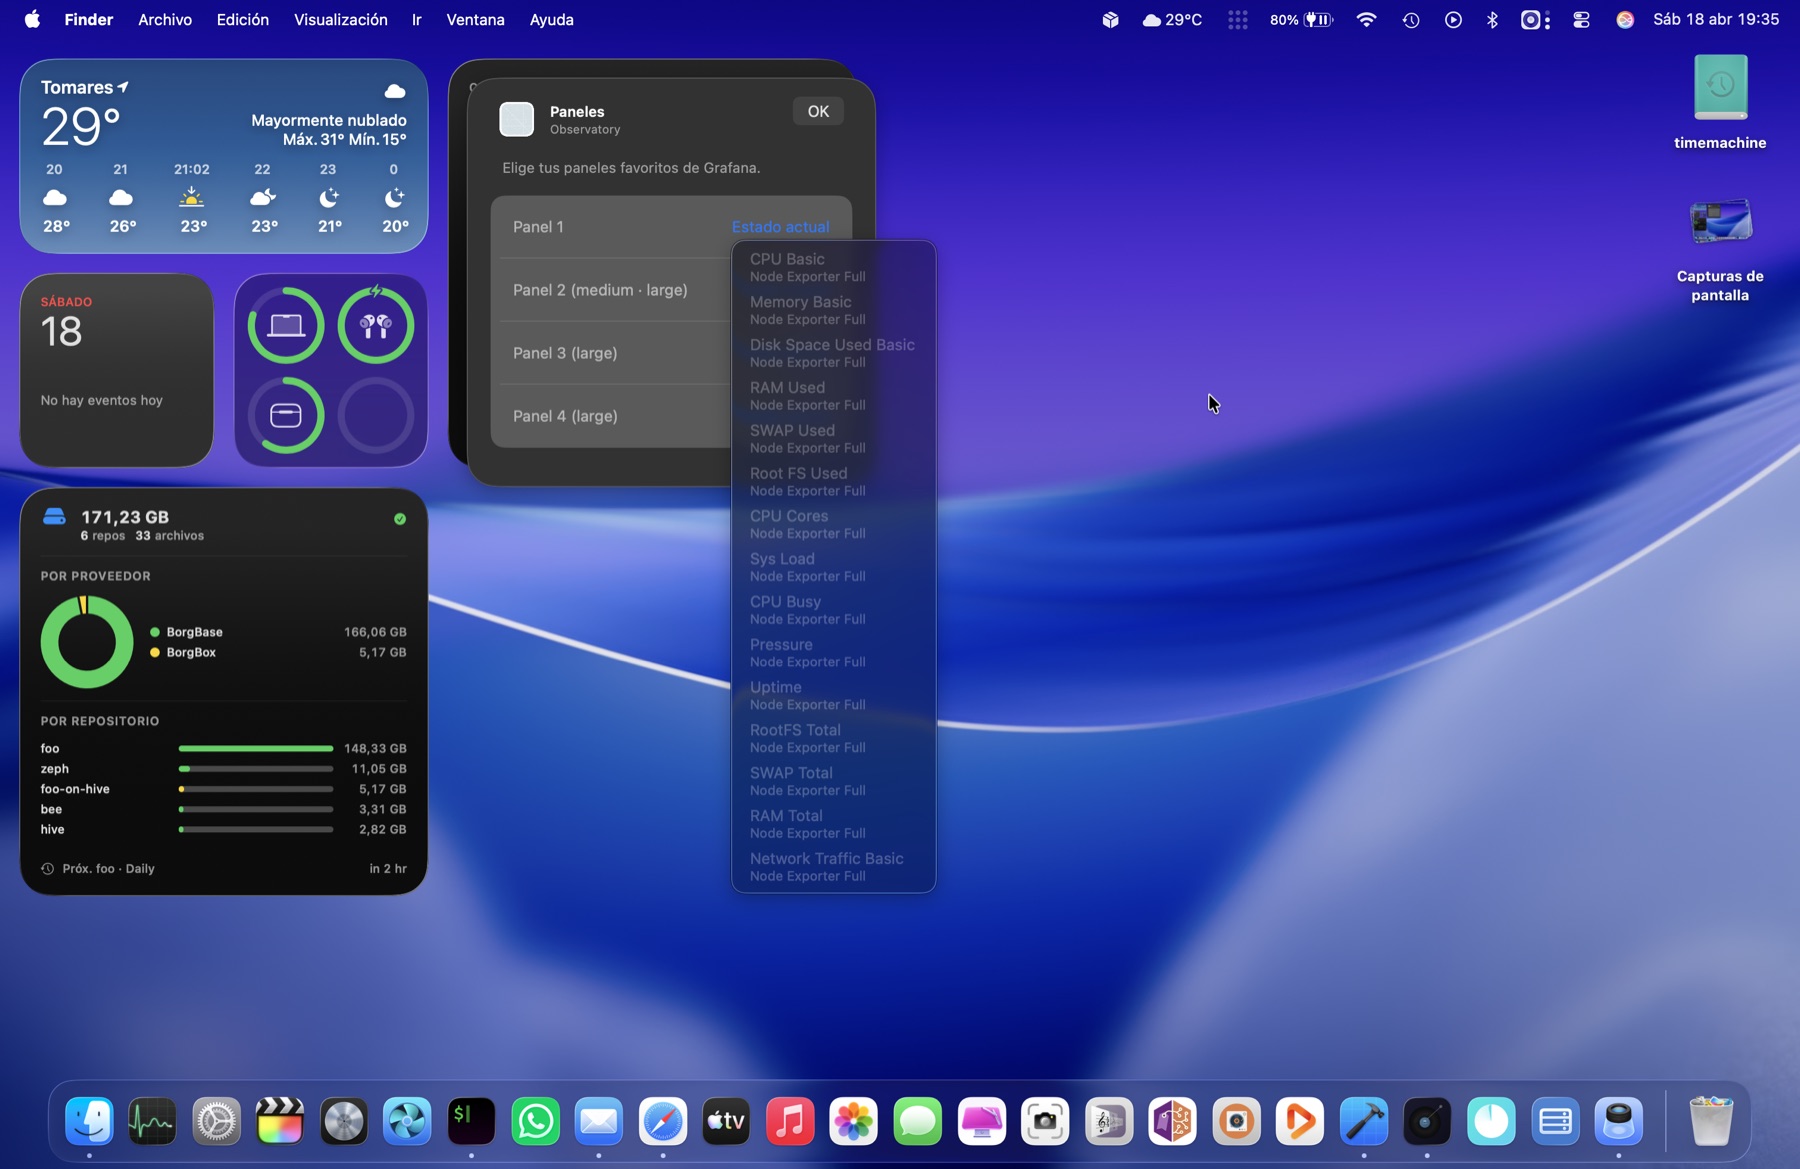
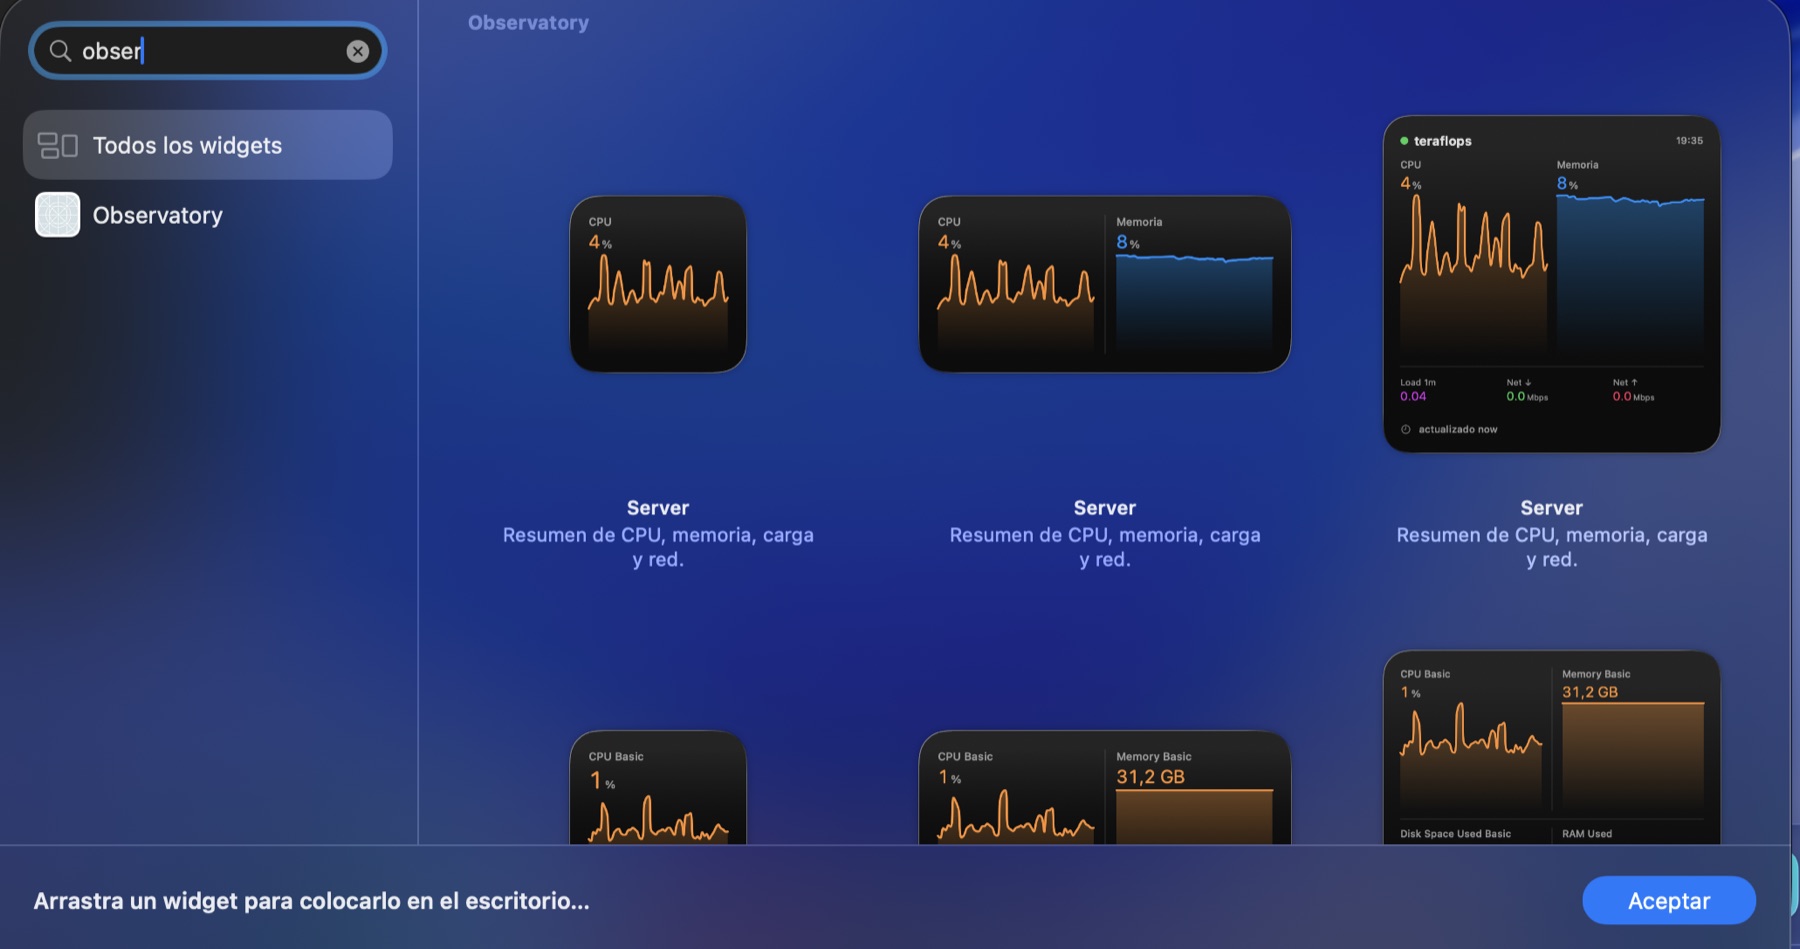
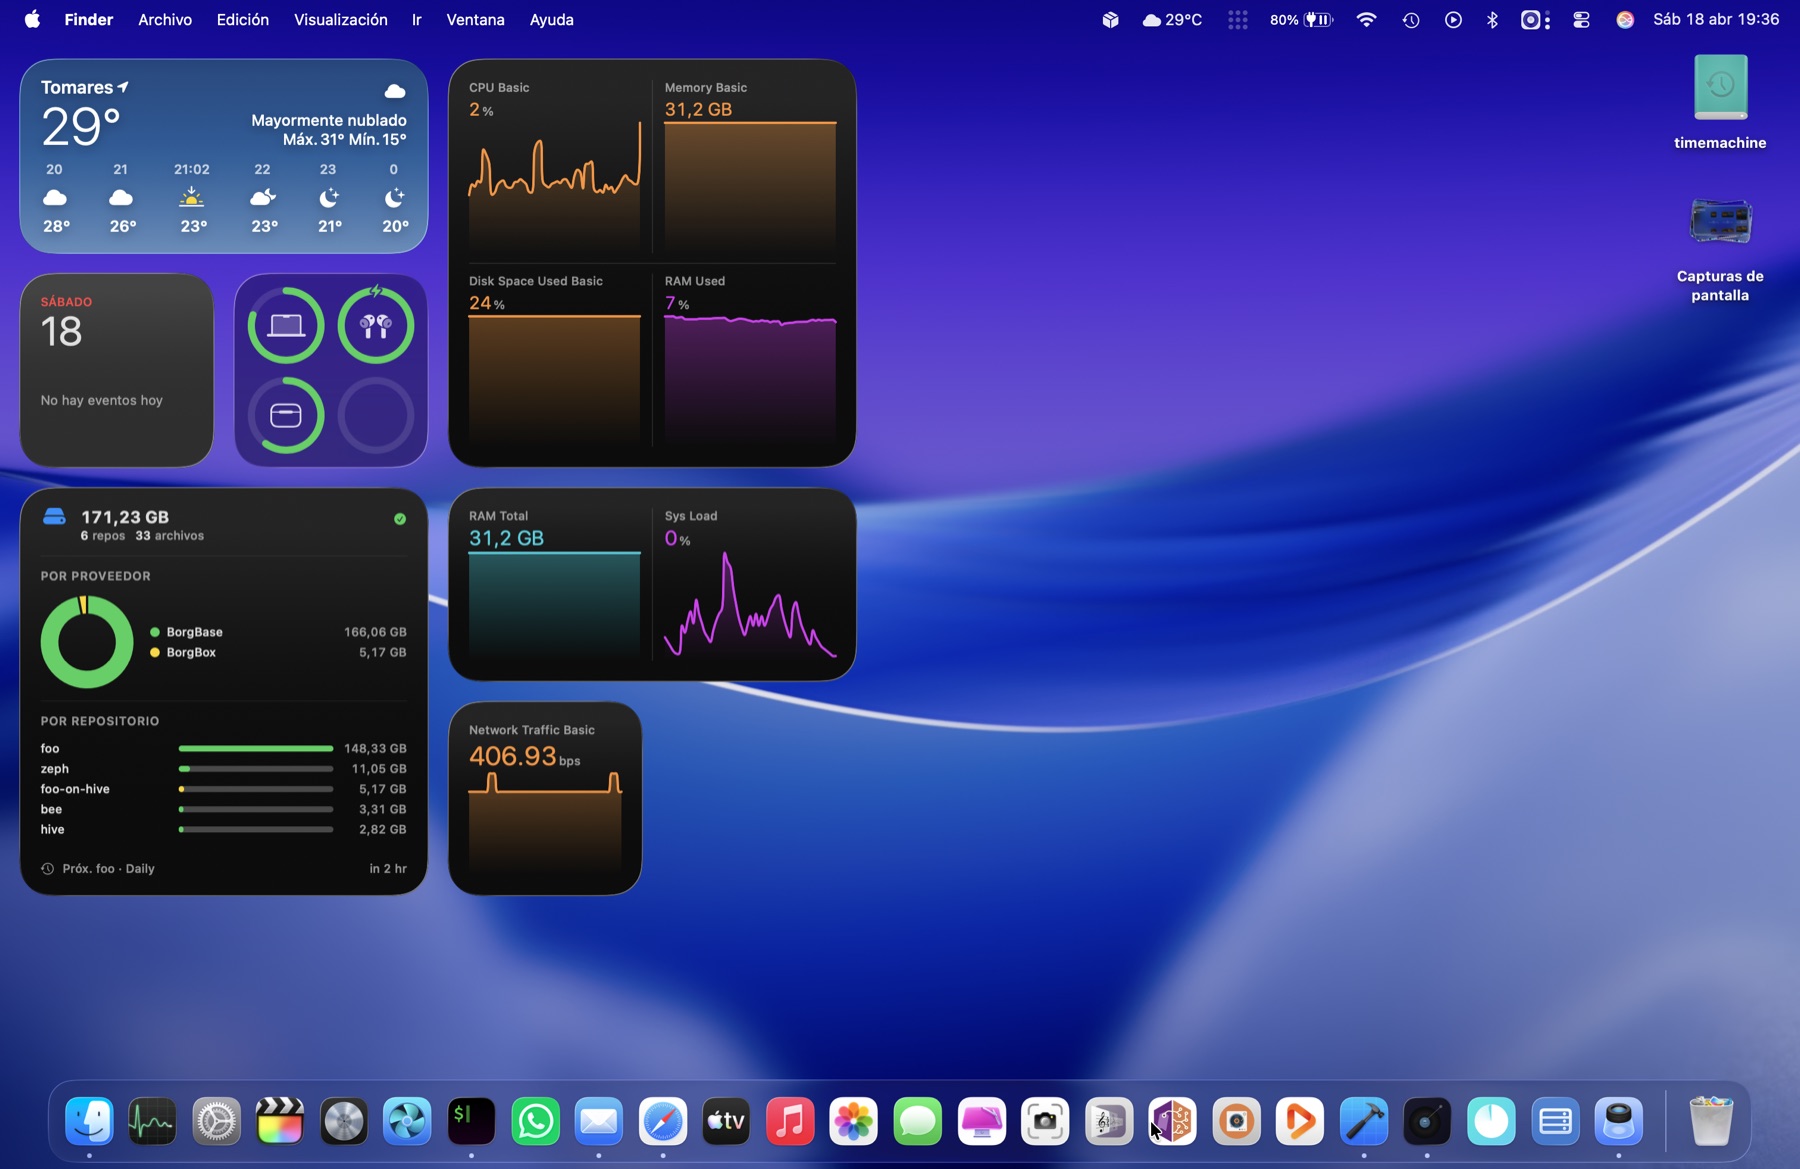
Native macOS widgets for Grafana. Browse your dashboards, pick any panel, watch it live on your desktop — rendered with SwiftUI Charts, not PNG snapshots.
Fake data on this page. In the app, these are your own Prometheus queries.
Observatory doesn't scrape Grafana screenshots. It reads the panel's query, sends it to your datasource via Grafana's own /api/ds/query, and renders the result with Swift Charts — same data path your browser uses, but native and GPU-accelerated.
Observatory is a small, opinionated companion — not a Grafana replacement. It does one thing well: put the metrics you already watch on your desktop, native and fast.
Every sparkline is drawn with Apple’s Swift Charts. GPU-accelerated, crisp at any size, no PNGs, no iframes, no blurred screenshots.
Browse every dashboard in your Grafana. Check any panel — the query, datasource and unit snap into a widget slot. No YAML, no config files.
Small, medium, and 2×2 large. The configurable widget lets you pick up to four panels per instance from your favourites.
Point it at your own Grafana. Your service account token lives on your Mac. The only network call it makes is to you.
HTTPS with a real cert, or HTTP on your local network. No self-signed circus, no custom trust stores, no support-ticket rabbit holes.
Developer ID code signed and notarized with Apple. Hardened runtime on. Open it, run it, add it to the Dock.
Paste the URL, a service account token and your datasource UID. Observatory lists every dashboard, grouped by folder, with badges for panel type.
Every large widget has four panel slots. Small renders slot 1, medium slots 1–2, large is a 2×2 grid. Pick any mix.
Stars in the dashboard browser add panels to your favourites. They show up as dropdown options in every slot — CPU Basic, RAM Used, Sys Load, Network Traffic…
Observatory registers small, medium and large widgets with macOS. Drag any of them from the standard widget gallery, just like Weather or Calendar.
WidgetKit refreshes each sparkline in the background. CPU, memory, disk, load, network — live from your own Grafana, rendered with Swift Charts.
Observatory 1.1.0. macOS 14 or later. Signed with a Developer ID and notarized — no scary Gatekeeper dialog.
14-day free trial from first launch. When you're ready to buy, do it from inside the app — Settings → License → Buy a license opens checkout, paste the key back into the same window and you're set.
~4 MB · one-time purchase · powered by Lemon Squeezy